

In this post you are going to learn how to use all the filters that Data Studio allows you to use to analyse your data.
Of course, at this point you have to understand what we call a filter. Because if you have already worked a little with Looker Studio, it is likely that the first thing that comes to mind when you think of a filter are the available controls: the drop-down list, the fixed-size lists or the advanced filters. That is to say, these here 👇🏼
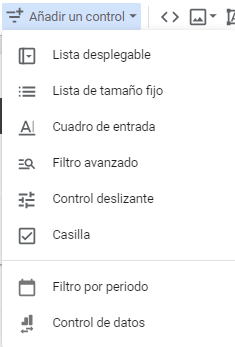
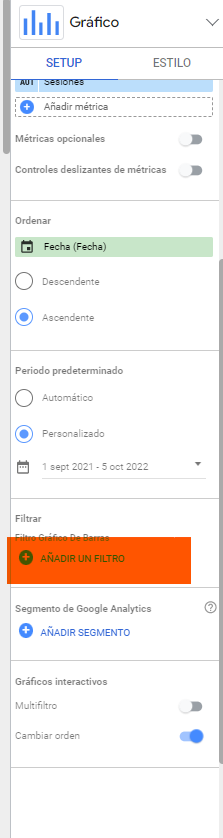
But, in fact, Looker Studio allows you to filter data in many other ways, some of them more or less creative. You can use the graphs themselves to filter, you can use segments and you can even use… filters. Because actually, the option we have pointed out above are called “controls” (but I don’t think anyone calls them that) and the filter option as such would be this one here, which we are not going to talk about today
The important thing here is to understand how to use the tool so that we can adapt it to what we need at any given moment. Therefore, in this post, which started with a rather ambitious paragraph, I thought that, so that the post is not too long and is no longer practical, we will focus on the controls to filter the data and, in a later post, we will work with ways to filter the contents in Looker Studio without resorting to the data controls.
The period selector
This is the easiest way to filter data in Data Studio. The tool allows us to introduce a series of filters to visualise our data in a very intuitive way and the most intuitive of all, probably also the most used, is the Filter by period.
It doesn’t have many secrets. The filter period allows us to select in which period we want to see certain data. By using it we will be able to select a predetermined period of time in which to view our data.
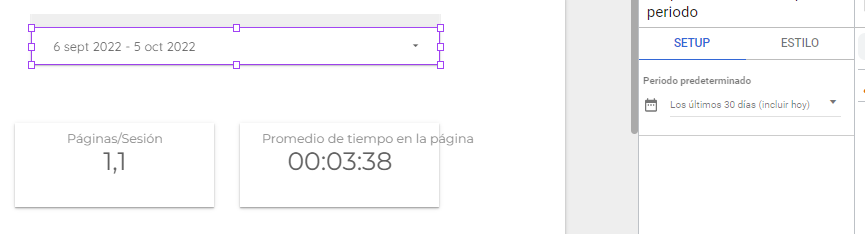
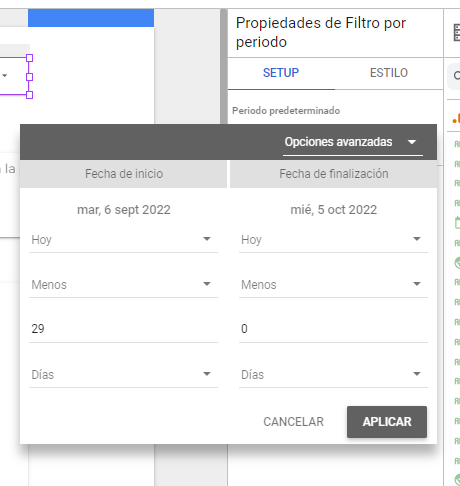
When you scroll down the setup options there are a number of options, quite intuitive, that are not worth explaining. If this is your first (or second) time with Looker, it may be worth scrolling to the end to find the “advanced options”.
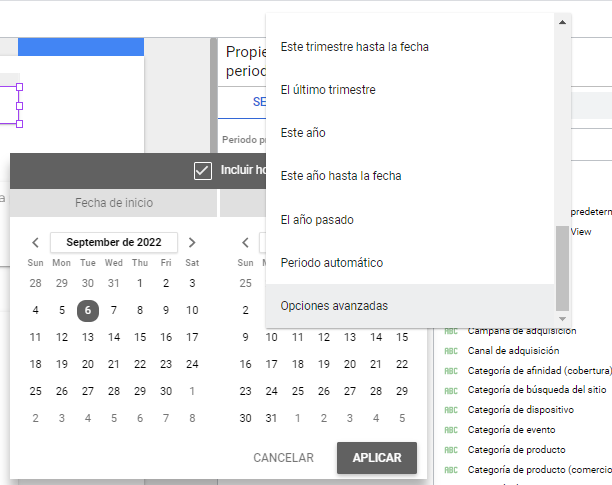
This is where you will be able to play with time periods adapted to what you need. This is the same type of filter that we will find later in the graphs and allows us to play quite freely between different time periods.
One period filter to bring them all together
With the period filter we will be able to define the time period for which we want to update our data. But very often we will have different pages in a report. Looker allows us to use a single control that applies to all our pages.
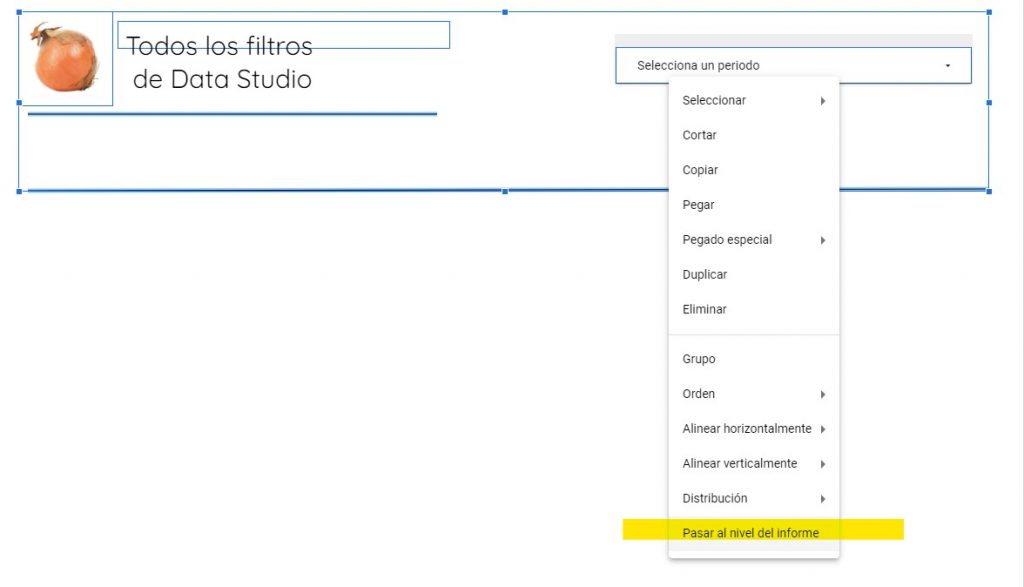
It is true that we often associate Looker Studio as a tool to build dashboards in Analytics and, in general, to work with Google services (Search Console, Adwords…). But in the end it is a tool with which we will be able to create dashboards for the different data sources that the tool allows us to work with. We are not going to stop here to talk about all the connectors that are already available in Looker, but there are quite a few. The thing is (and I don’t want to go on much longer about this) is that the advantage of the period selector is that, like the famous ring, we will be able to use just one to control them all. So the first practical tip of the day is to use the “go to report level” option.
Let’s see it with a simple example. In my case, for this sample report, I am going to create a header that will include my logo (yes, the one on the left is my logo) with the title of the report, the period selector (that will appear in all the pages) and a space below that I will use as a submenu to place the different filters that we use.
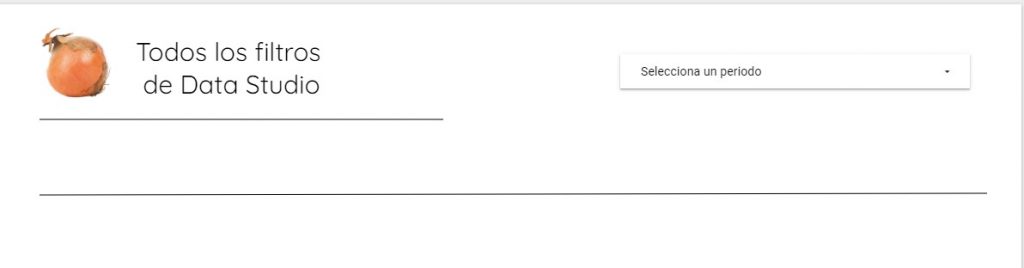
And that’s it, now we have a header that we can use in our report and, in addition, a period selector that will allow us to build our reports faster and update them even faster.
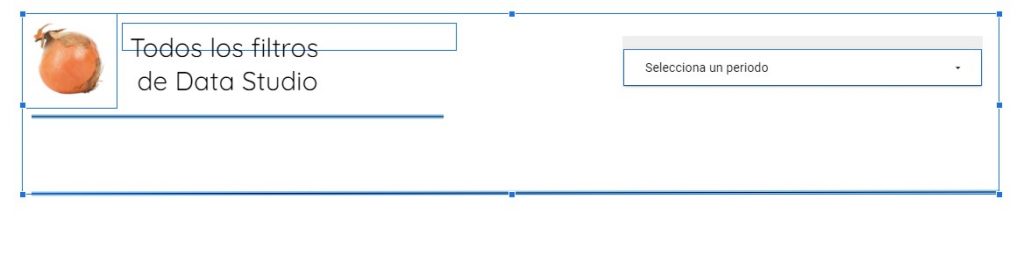
Once the elements are moved to the report level, when selected, they will appear framed in purple, as opposed to the rest of the elements in blue. A minor detail, but an important one.
The problem with passing elements, in particular, the period selector to the report level is that…. it works, that is, it works all the time. So, if you are going to include pages with different data sources in your report and there are elements that are not relevant on all pages, you should not use this option, because the elements you include at the report level will appear as well. It would be nice if Looker Studio would allow you to include exceptions or assign controls to specific pages, but we are not there yet.
Enter a drop-down list
We have started at the end and are now back to the beginning. We skip the “data control” because I understand that it can be used in a different way and I would like to make an entry of my own. Now we go back up in our options and go to the 👇🏼 drop-down list.
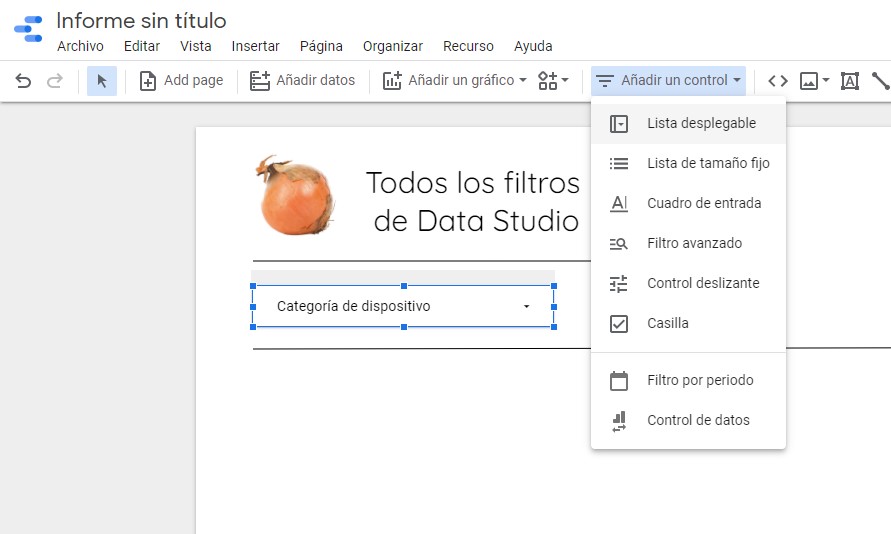
The drop-down list will allow us to filter the values of a dimension. It is possibly the filter par excellence. A very common use, when making Analytics reports, is to use it to filter device categories. The drop-down list shows all the values included in a given dimension, so it is much more practical for relatively short lists of dimensions.
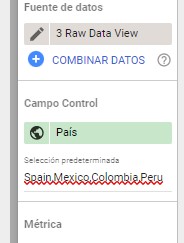
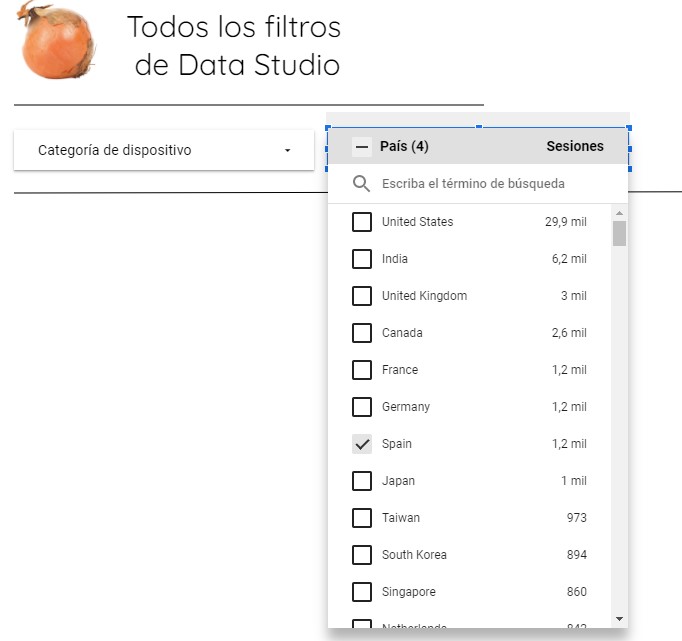
However, it may be the case that, within a large list of options, you are only interested in a few options. For example, let’s say we have a list of countries from which we are receiving traffic. The list is very broad, but all my traffic comes from a set of specific countries. We can make this the default value to be filtered in the report, although the rest of the dimensions are selectable.
This is an elegant way to avoid, for example, typical reports where country versions are duplicated because a client has asked to have a default view for a country, a region etc. We can use the drop-down list to define a filter that applies to all page elements.
The input box
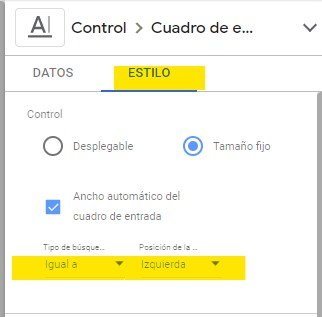
The “Input Box” filter has always seemed to me to be a sort of downgraded version of the “Advanced Filter”, but this is really a matter of taste. Admittedly, the “Input Box” allows for a lighter form of search and, in certain cases, can probably be considered a more elegant version, at least aesthetically.
The problem with the “search by input box” is that, by default, searches are performed by the search type “equal to” which is a problem because, in my case at least, I am almost never entirely clear about the exact name of the term I want to search for (capitalised or uncapitalised, in English or Spanish, with or without accent – the internet is not exactly the realm of spelling). Even for the most commonly used dimensions (let’s say, for example, channel searches in Google analytics) I always have some doubt about how exactly this term has been written. That’s why I think that, if we are going to use this kind of filter, it is sometimes more practical to define the search type as “contains”.
For some reason, defining this kind of functionality is not in the “Data” tab but in “Style”, so we will have to go there to change the search option. In the style tab we will also be able to play with the exact position in which the dimension name appears.
Employ of the advanced filter
The advanced filter, at its core, works very much like the input box. The real difference is that the search options are included in the same control, so you can play with them without having to go into edit mode.
Except for aesthetic options, it seems to me to be superior to the search box in all respects. It’s true that the drop-down may spoil the aesthetics of the report a bit, but otherwise I see no reason not to always use this filter instead of the search box.
In any case, it is a good time to review the types of search we can use with the advanced filter and the search box:
Sliders
The slider control is the ugly duckling of all the Google Looker Studio controls, although it has to be said that this is an unfair reputation. The problem with sliders is that they allow you to choose from a range of values within a dimension, so they won’t work for category dimensions. On the other hand, they can be very useful for numerical dimensions. It is true that, for example, in Analytics or Search Console very few dimensions are numerical, so, to give an example of using sliders, we are going to generate a numerical dimension that might be useful for SEOs.
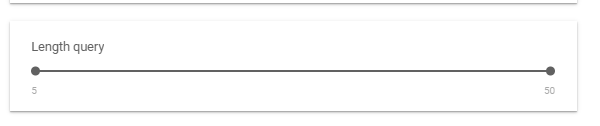
We go to Google Search Console and we are going to create a new field that we are going to use to control the length of the keywords. Why? Well, although it is not a fixed rule, longtail keywords are usually longer keywords, so it can be a way to find longtail keywords when we have many keywords in our GSC.
We are going to use the formula length(query) and create a dimension called Length Query. This dimension will allow us to group the queries by the number of characters that form it and we will be able to use this dimension in the sliders like this 👇🏼
Having said that, I recognise that, in general, I find it much more useful to use the sliders, for example, in a table, where we will be able to use the slider on the metrics, but this is part of another way of filtering and is therefore for another post.
